

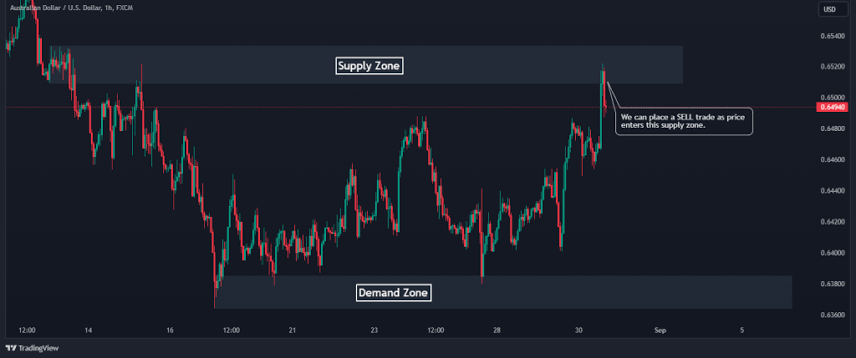
Supply and demand zones represent specific price areas on a chart where institutional order flow creates major imbalances between active buyers and sellers. By learning how to spot these distinct chart regions, market participants can better anticipate where large orders originate and improve the accuracy of their entry points. This technical methodology is applied across multiple financial instruments, including currency pairs in foreign exchange markets.
Understanding Structural Market Imbalances and Order Blocks
Market imbalances occur when aggressive institutional buying or selling overwhelms available liquidity, leaving unfilled orders that price often returns to test later. A supply zone forms when heavy selling pressure abruptly reverses a previous upward move, while a demand zone develops when aggressive buying pushes price sharply higher out of a tight consolidation range. Recognizing these underlying order blocks allows traders to look past random chart noise and focus directly on areas where institutional participants have previously committed significant capital.
Decoding Rally-Base-Drop and Drop-Base-Rally Chart Formations
Successful technical execution depends heavily on identifying classic structural price patterns that mark the birth of institutional zones. Supply areas typically display a rally-base-drop sequence where prices rise, pause in a narrow base, and plummet rapidly. Demand areas display a drop-base-rally sequence where prices decline, pause in a consolidation base, and surge upward. Continuation variations like drop-base-drop or rally-base-rally also highlight how existing trends pause briefly before resuming their primary directional path.
| Formation Type | Price Action Sequence | Institutional Market Meaning |
|---|---|---|
| Supply Reversal | Rally – Base – Drop | Sellers take control after a consolidation pause, creating overhead resistance. |
| Demand Reversal | Drop – Base – Rally | Buyers accumulate positions after a decline, establishing support below. |
| Bearish Continuation | Drop – Base – Drop | Downtrend pauses briefly before sellers resume aggressive downward momentum. |
| Bullish Continuation | Rally – Base – Rally | Uptrend consolidates temporarily before buyers push price higher again. |
A Practical Workflow for Mapping Zones on Price Charts
Mapping these zones effectively requires a consistent visual routine that avoids cluttering trading software with unnecessary indicators. Traders begin by scanning charts for sharp, impulsive candles that break away cleanly from a narrow consolidation range or base. Once an impulsive leg is located, drawing a rectangle around the entire range of the base candle ensures the entire order block is captured rather than just a single closing price line. This rectangular zone serves as a reference area to monitor whenever price action eventually returns to test the level.
Why Institutional Traders Focus Exclusively on Higher Timeframes
Higher timeframes like daily and weekly charts filter out minor intraday market fluctuations and highlight zones where large financial institutions execute massive transactions. Lower timeframes often generate false breakouts and unreliable signals due to retail noise and algorithmic scalping. Aligning chart analysis with daily and weekly horizons ensures that traders operate in harmony with macro-level order flow rather than fighting against dominant institutional positioning.
Executing Trades via Reversals, Breakouts, and Ranges
Traders deploy distinct tactical frameworks depending on how price interacts with mapped supply and demand areas during live sessions. Reversal trading involves waiting for price to pull back into a demand zone to enter long positions, or approaching a supply zone to enter short positions. Breakout trading occurs when a sustained price impulse punches directly through a weakened zone rather than bouncing, signaling trend continuation. Range trading takes advantage of sideways market conditions by buying near lower demand boundaries and selling near upper supply barriers.
Mitigating Risk and Avoiding Common Chart Pitfalls
Managing risk properly is essential because even well-defined zones can fail during periods of unexpected macroeconomic volatility or strong trend momentum. Traders frequently lose capital by fighting the broader market trend or entering trades blindly the exact moment price touches a zone without waiting for candlestick confirmation. Placing protective stop-loss orders safely beyond the extreme wick of the base candle prevents normal market noise from triggering premature exits.
Summary and Technical Execution Takeaways
Studying institutional order flow through supply and demand zones provides traders with a structured lens for interpreting market charts without relying on lagging indicators. By focusing on higher timeframes, identifying impulse candle structures, and maintaining disciplined risk controls, participants can improve their trade execution precision. For professionals navigating complex commercial agreements or managing business disputes that arise during professional trading ventures, understanding how arbitration can help resolve business disputes faster and more cost-effectively remains an important legal resource. Continuous observation and strict trade planning ultimately dictate long-term consistency in technical market analysis.
Frequently Asked Questions
How do supply and demand zones differ from traditional support and resistance?
Traditional support and resistance levels are usually marked as single lines across historic swing points, whereas supply and demand zones use rectangles to highlight an entire price range where institutional orders accumulated.
Why are zones drawn as rectangles instead of lines?
Rectangles account for the entire price breadth of the base consolidation candle, recognizing that institutional orders are executed across a price band rather than at one exact price point.
Which chart timeframes provide the most reliable zones?
Daily and weekly charts offer superior reliability because they filter out intraday retail noise and reveal major institutional order blocks.
Where should stop-loss orders be placed when trading these zones?
Stop losses are typically positioned just beyond the extreme outer boundary of the base candle structure to protect against routine market wicks and false breakouts.
What does a rally-base-drop formation signify?
A rally-base-drop formation signifies a supply zone where buyers initially drove prices higher before a period of sideways consolidation preceded an aggressive downward sell-off.
Can this technical framework be used in currency trading?
Yes, currency traders frequently apply this exact structural approach across major and minor pairs within the foreign exchange market.
Disclaimer: The details shared in this article are for educational reference only and should not be construed as formal financial advice. Financial markets involve high risk, and traders must verify all data and market conditions through official sources before placing live trades.

Passionate content writer and savvy blog publisher, Aamir crafts compelling stories and insightful articles that captivate and inform. With a knack for blending creativity and strategy, they bring fresh perspectives to every piece. Dive into their world of words and discover content that resonates.


