
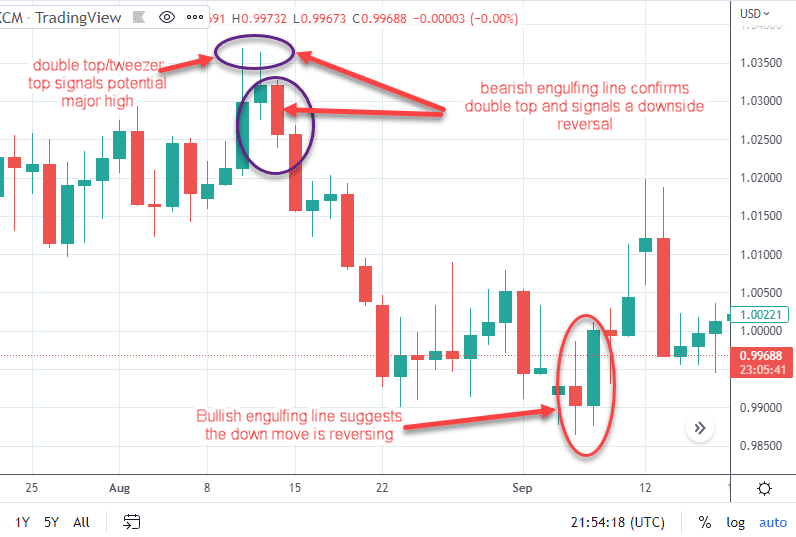
Candlestick charts remain an essential cornerstone of technical analysis, offering foreign exchange market participants a direct window into shifting buyer control and seller exhaustion. Tracing their historical roots back to 18th-century Japanese rice merchants, these visual formations have evolved into an indispensable tool for deciphering momentum across global financial exchanges. When applied specifically to currency pairs, candlestick charts visually distill complex macroeconomic forces into straightforward price signals that help traders evaluate directional bias.
Anatomy of a Forex Candlestick and Price Action Mechanics
Every single candlestick on a currency chart is constructed from four primary data points: the open, the high, the low, and the close during a specified timeframe. The thick central rectangle, known as the real body, highlights the distance between the opening price and the closing price for that specific duration. The thin lines extending above and below the body are referred to as wicks or shadows, mapping out the absolute highest and lowest price extremes reached during the trading session. Understanding these structural components allows traders to look past raw numbers and immediately recognize whether aggressive buyers or determined sellers dominated a given trading hour or daily session.
The color of the body adds an extra layer of immediate insight into market bias across currency pairs. A green or white body indicates that the closing price settled higher than the opening price, reflecting underlying bullish momentum. Conversely, a red or black body signifies that the closing price dropped below the opening level, pointing toward bearish control. Longer bodies generally indicate strong conviction behind a price move, while extremely short bodies suggest hesitation or a prolonged tug-of-war between opposing market participants.
Core Candlestick Formations for Currency Pair Analysis
Candlestick formations are generally classified by how many individual bars make up the signal, ranging from single formations to complex three-bar sequences that highlight shifts in market psychology.
| Pattern Category | Pattern Name | Visual Structure | Forex Market Meaning |
|---|---|---|---|
| Single | Doji | Very small body, long upper and lower wicks | Indecision; often signals potential trend exhaustion during major forex sessions. |
| Single | Hammer | Small body at the top, long lower wick | Bullish reversal signal typically found at the bottom of a currency pair downtrend. |
| Two-Candle | Bullish Engulfing | Small bearish candle completely engulfed by a large bullish candle | Indicates buyers have overpowered sellers, signaling a potential upward reversal. |
| Two-Candle | Dark Cloud Cover | Bullish candle followed by a bearish candle opening higher and closing below midpoint | Bearish reversal warning appearing during an established currency uptrend. |
| Three-Candle | Morning Star | Bearish candle, small gap-down candle, followed by a strong bullish candle | Strong confirmation of a bullish trend reversal from a recent currency low. |
| Three-Candle | Evening Star | Bullish candle, small gap-up candle, followed by a strong bearish candle | Strong warning sign of an upcoming downward reversal from a currency peak. |
Navigating 24-Hour Liquidity and Forex Session Overlaps
Foreign exchange markets operate on a continuous 24-hour cycle across multiple global financial centers, introducing unique liquidity dynamics that influence how candlestick patterns perform. Unlike equity exchanges that close daily, currency pairs experience distinct session overlaps, most notably when the London and New York trading sessions intersect. During these high-volume windows, price action is typically cleaner, and breakout signals derived from candlestick formations tend to carry higher reliability than during quiet Asian session hours.
Furthermore, currency trading relies heavily on high leverage, which amplifies both potential gains and losses. Because foreign exchange pairs are quoted in fractional price increments known as pips, minor psychological shifts can trigger massive intraday swings. Institutional order flow and central bank interventions can invalidate classic technical patterns in seconds. Traders must account for these institutional footprints rather than relying on technical formations in a vacuum.
Integrating Macroeconomic Drivers and Technical Support Zones
Successful currency traders never rely on candlestick formations alone, choosing instead to anchor their visual analysis within a broader framework of technical and fundamental indicators. Pairing reversal patterns with established horizontal support and resistance zones significantly improves probability. For example, a hammer pattern forming directly on a multi-month support level carries vastly more weight than the exact same pattern appearing in the middle of a random trading range.
Adding momentum oscillators like the Relative Strength Index or the Moving Average Convergence Divergence further refines the entry process. When a bullish engulfing signal coincides with an oversold reading on momentum indicators, the resulting trade setup offers a far more robust risk-to-reward ratio. Additionally, monitoring macroeconomic data releases, such as interest rate decisions and employment reports, helps traders avoid entering positions right before high-impact news events that can shatter technical boundaries. To deepen your understanding of how broader fiscal policies shape currency pair behavior and technical reactions, read our detailed analysis on the influence of economic policies on currency markets.
Managing Pip Risk and Stop-Loss Placement in Currency Pairs
Disciplined risk management remains the single most important element when trading currency markets based on technical chart setups. Setting appropriate stop-loss orders protects trading capital from unexpected volatility spikes or false breakouts. A common practice among experienced currency traders is to place stop-loss boundaries just beyond the extreme wick of the signal candle, factoring in the prevailing currency spread and specific pip value of the traded pair.
Position sizing must also reflect the distance of the stop loss from the entry price. If a candlestick formation requires a wide protective stop because of extreme market volatility, the overall trade size should be scaled down to maintain a consistent risk percentage per trade. Avoiding emotional overtrading and accepting that even the most reliable formations fail on occasion keeps accounts safe over the long term.
Frequently Asked Questions About Candlestick Trading
What is the most reliable candlestick pattern for currency trading?
While reliability varies based on market context, engulfing patterns and morning or evening stars are widely favored because they involve multiple candles confirming a shift in momentum.
Why do candlestick patterns fail in forex markets?
Patterns frequently fail when traded in isolation without considering higher timeframe trends, overall liquidity conditions, or unexpected macroeconomic announcements.
What timeframe is best for analyzing currency candlesticks?
Higher timeframes such as the 4-hour and daily charts generally produce more reliable signals with fewer false breakouts compared to 1-minute or 5-minute charts.
How do I confirm a candlestick trading signal?
Traders typically confirm signals by checking whether the pattern aligns with key support or resistance levels, volume metrics, or momentum indicators like the RSI.
Can I trade forex using only candlestick charts?
Relying exclusively on candlestick charts is generally discouraged; combining them with macroeconomic analysis and proper risk management produces much better outcomes.
How should I set stop-loss orders around candlestick patterns?
A standard approach is placing the stop loss slightly beyond the highest wick for short trades or below the lowest wick for long trades, accounting for standard market spreads.
Disclaimer
Technical analysis and candlestick interpretation involve substantial financial risk and do not guarantee profitable trading outcomes. Market conditions fluctuate rapidly, and past pattern performance is never an indicator of future results. Readers should always verify final trading information and consult professional financial advisors before executing live market orders.

Daniel J. Morgan is the founder of Invidiata Magazine, a premier publication showcasing luxury living, arts, and culture. With a passion for excellence, Daniel has established the magazine as a beacon of sophistication and refinement, captivating discerning audiences worldwide.


